
Drawing plots is one of the important way of showing the data in a structured manner and one can draw inferences easily out of it. We call it Data Visualization. We use python libraries extensively for such plotting. Matplotlib is a python 2D plotting library used for such data visualization. Matplotlib has extensive set of API which can be called in our programs for plotting. Adding to this, the plots can be customized as per our requirement. Various plots are:
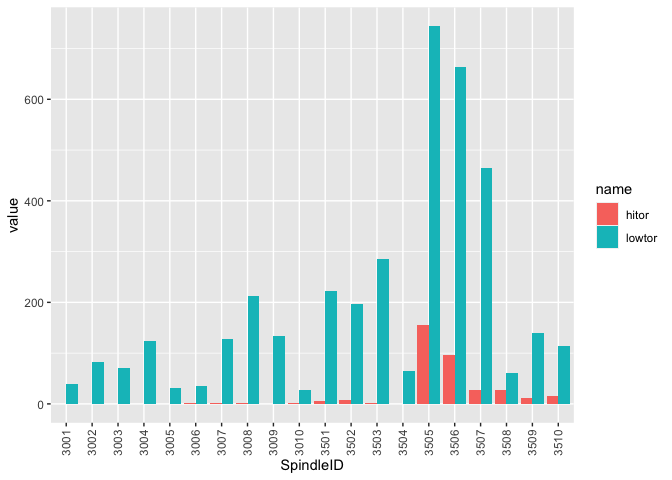
Bar plot:
Scattered plot:

box plot:


stair plot:

 ]]>
]]>


0 Comments